
How to Track Emerging Trends Before They Go Mainstream
Tech

The systems, signals, and methods that separate early movers from everyone else — and how to build your own trend detection engine from scratch.
Most people discover trends the same way: they notice something showing up more often in their feed, their meetings, or their competitor's marketing. By the time that happens, the trend is already mainstream and the window to act on it — to build a product, write the definitive piece, shift a portfolio, or pivot a campaign — has mostly closed.
The organizations and individuals who consistently move early aren't luckier or more plugged in, but running systems (whether sophisticated or scrappy) that surfaces weak signals from noisy environments before those signals compound into obvious patterns.
This piece is a full breakdown of how to build that infrastructure. We'll cover where early signals actually live, the technical and statistical methods that separate real emergence from noise, and how to stand up a lightweight detection pipeline yourself — even if your "data team" is just you and a Claude prompt.
Why Trends Are Invisible Until They're Obvious
There's a structural reason most people miss emerging trends: the data sources they rely on are lagging indicators.
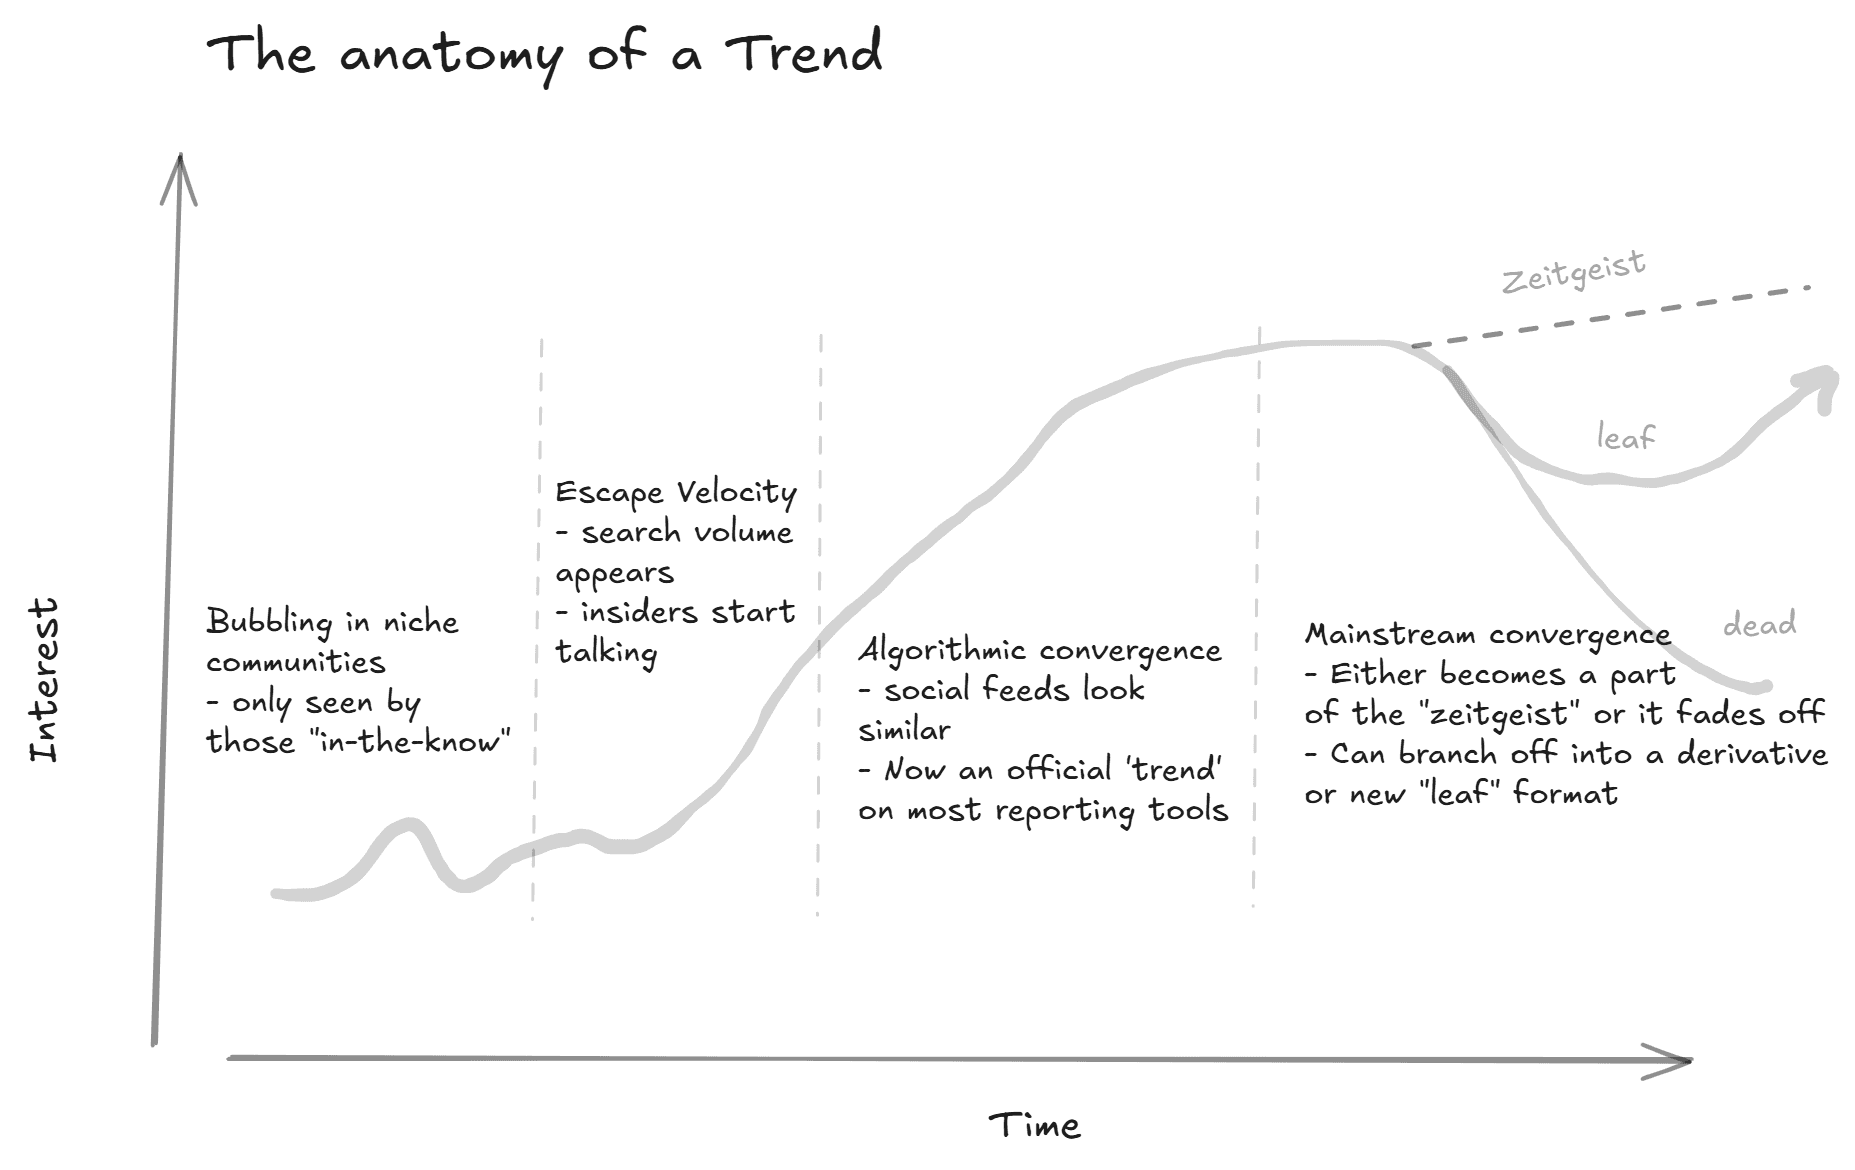
Google search volume, trending terms on social media platforms, mainstream media coverage, quarterly earnings calls, industry analyst reports — these all reflect established interest. Search terms on Google must generate enough volume to even register, and by the time a topic generates enough search volume to register on Google Trends, thousands of people are already searching for it. This might be a non-issue depending on the trend (a few thousand is still very early!), but by the time a cultural or financial analyst writes about it, it's an indicator that the underlying behavior has compounded for too long and you're at the 'peak'.
The real signal lives upstream, in environments where early adopters, niche practitioners, and obsessive communities concentrate. These environments are messy, unstructured, and high-volume, and precisely why they're valuable — most organizations can't process them efficiently, so the information advantage persists for those who can or those with extreme situational awareness (just tapped in naturally).
The gap between "emerging" and "mainstream" is collapsing. Micro-trends on platforms like TikTok and Reddit now cycle through their entire lifecycle in one to three weeks, compared to months in prior years, with that compression forcing the cost of being late being higher than ever, and the reward for being early is more asymmetric.
Where Early Signals Actually Live
Before we get into methods, it's worth mapping the landscape of signal sources — because the choice of where you look determines the ceiling of what you can find.
Niche Online Communities
Reddit, Discord servers, niche Telegram groups, specialized forums, 4Chan (although considered less relevant now by some) and GitHub repositories are where emerging behaviors, preferences, and technologies surface first. These spaces concentrate early adopters who are actively experimenting, discussing, and building around nascent ideas.
Reddit alone crossed 100 million daily active users in late 2024, but the signal isn't in the aggregate (everyone on Reddit talking about "one thing"), it's in the subreddits. A sudden increase in post frequency, subscriber growth rate, or comment depth in a previously quiet subreddit is one of the earliest reliable indicators that something is shifting. Discord servers follow a similar pattern: a niche server that suddenly starts growing at 10x its historical rate is telegraphing something.
GitHub is underappreciated as a trend source outside of engineering. When a new repository starts accumulating stars at an accelerating rate, or when multiple independent developers begin building tools around the same protocol or API, that's a technical trend signal that typically leads the business conversation by six to twelve months.
Social Media Platforms (But Not How You Think)
The value of social media for trend detection isn't in monitoring what's trending — it's in monitoring what's about to trend. That means looking at velocity (% change), not volume.
A topic that jumps from 50 mentions per day to 500 in a week is a more actionable signal than one that's been sitting at 10,000 mentions for months. The first is accelerating; the second is established, and most social listening tools focus on the latter. Trend detection requires the former.
TikTok's subcultures are particularly potent signal sources. A hashtag that goes from 2,000 views to 200,000 in 72 hours within a specific aesthetic community — before it crosses over to mainstream creators — is a textbook early signal.
Academic and Patent Literature
For technology and science-driven trends, preprint servers (arXiv, bioRxiv, SSRN) and patent filings offer a 12–24 month lead over mainstream adoption. The pattern is consistent: a cluster of papers on a specific technique or approach is published, followed by startup formation, followed by venture funding, followed by enterprise adoption, followed by media coverage.
Tracking citation velocity — how quickly a paper accumulates citations — is one of the more reliable academic trend signals. A paper that gets 50 citations in its first three months is behaving differently from one that gets 50 over two years.
Search Data as Confirmation
Google search data is better used as confirmation of a trend you've already detected through upstream sources than as a discovery mechanism. The reason is structural: Google Trends shows you what people are already looking for, which means the awareness phase has already begun, especially as more people use the social network as a search engine itself.
That said, search data excels at one thing: separating real trends from noise. If a topic is exploding on Reddit and Discord but generating zero incremental search volume, it may be a community-specific phenomenon rather than a broader shift. If search volume is climbing in parallel, the trend has legs outside of the community.
The Technical Stack: How Trend Detection Actually Works
Now let's get concrete. Whether you're building a sophisticated pipeline or a weekend project, trend detection relies on a few core technical layers.
Layer 1: Data Collection (Scraping and APIs)
You need data before you can analyze it. For most trend detection use cases, that means pulling text data from social platforms, forums, news sources, and other public web sources.
API-based collection is the cleanest approach where available. Reddit's API, X's Data API, various news aggregation APIs, and platform-specific endpoints give you structured data with metadata (timestamps, engagement metrics, user information) that's critical for trend analysis. Important thing to note: these APIs can be EXTREMELY EXPENSIVE, costing thousands and sometimes millions of dollars just for access. Prices differ even more if used for commercial vs personal reasons as well.
Web scraping fills the gaps where APIs don't exist or are too restrictive. Modern scraping workflows typically combine a headless browser (Playwright or Selenium) for rendering JavaScript-heavy pages, a parsing layer (BeautifulSoup or LLM-based extraction) for pulling structured data from raw HTML, and a proxy rotation layer for handling rate limits. Web scraping can feel like a legal grey zone, but it's important to know that Terms of Service do not equal law. This has been the backbone of protecting companies from scraping lawsuits (see: X vs Bright Data, Meta vs Bright Data, or LinkedIn vs HiQ), when the data exists in the public domain.
The practical challenge isn't the scraping itself — it's doing it at scale, continuously, and transforming the output into something analytically useful. Most often, you're not looking for a one-time snapshot, but a time series: the same data sources, sampled at regular intervals, producing comparable measurements over time.
Layer 2: Natural Language Processing (Making Text Computable)
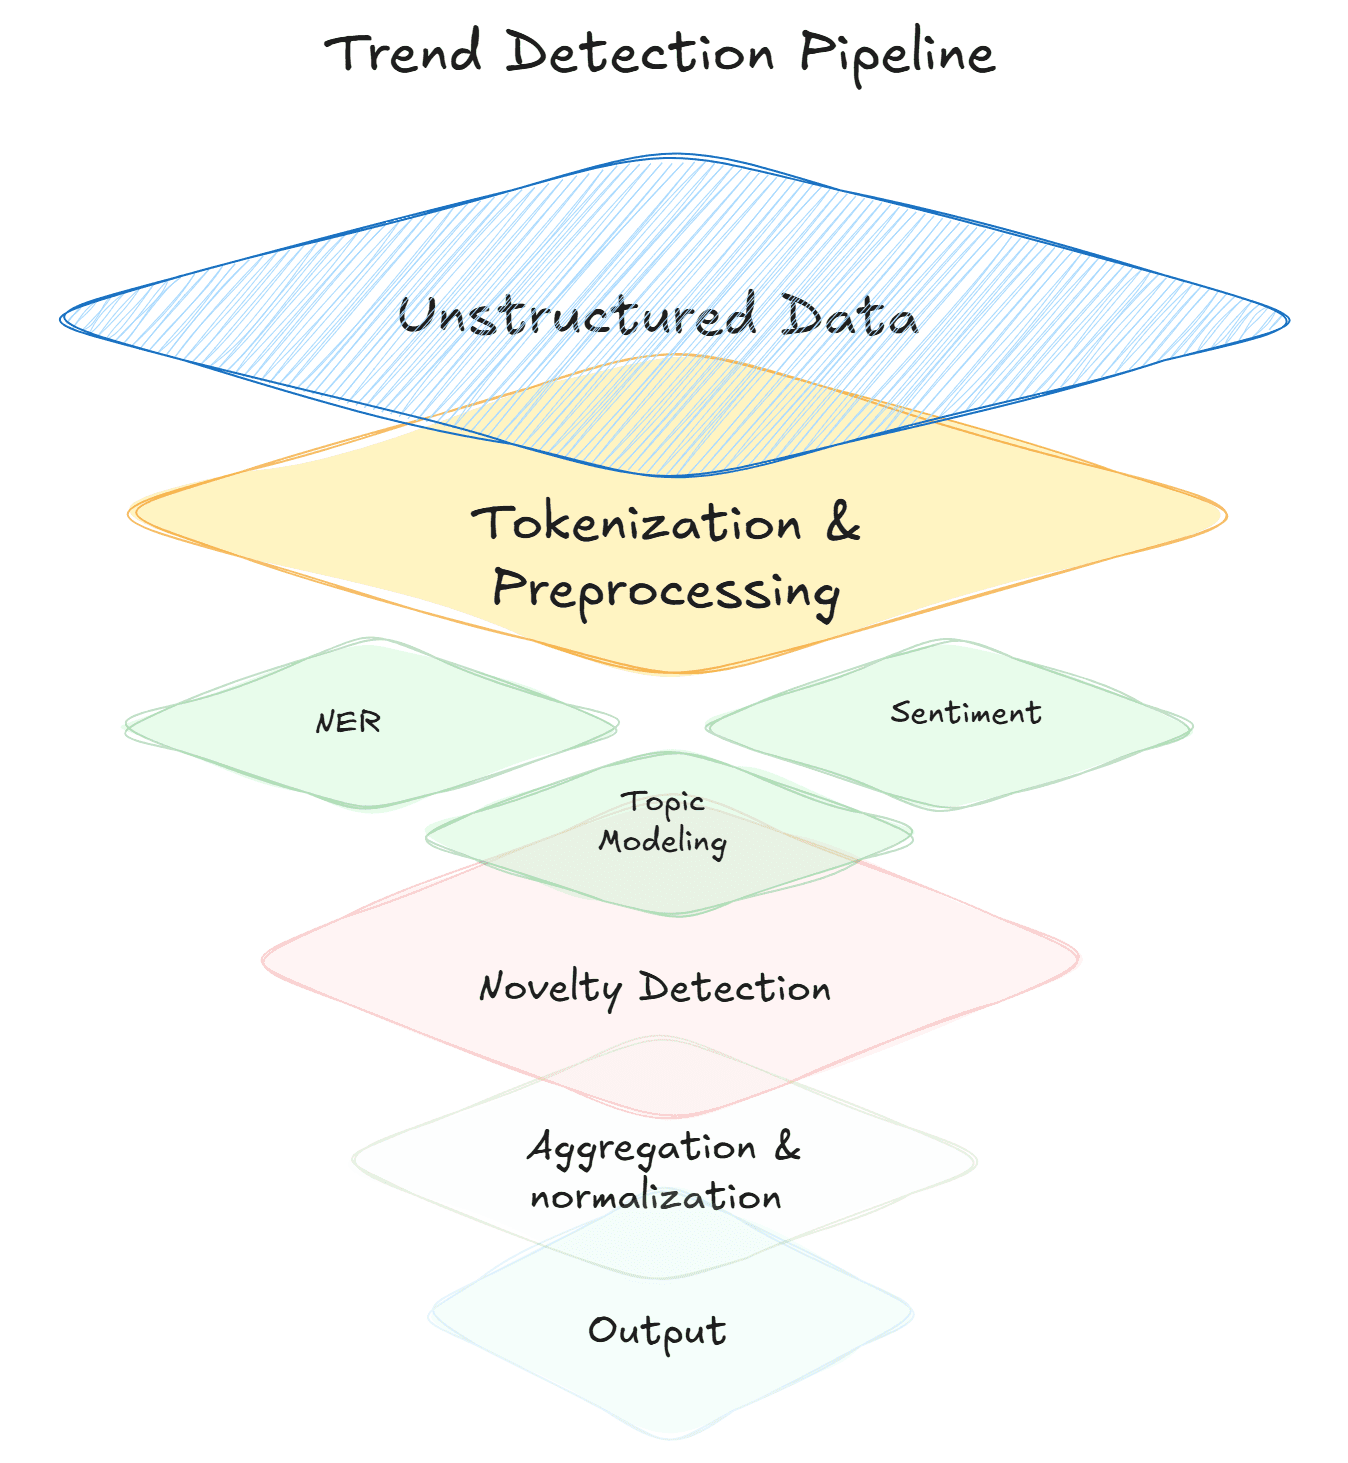
Raw text — Reddit comments, TikTok captions, forum posts, news articles — is unstructured. To detect trends in it, you need to convert it into structured signals. This is where NLP comes in.
Tokenization and preprocessing. Before any analysis, text gets broken into tokens (words or subwords), normalized (lowercased, lemmatized), and cleaned (stop words removed, noise filtered). This is plumbing, but it determines the quality of everything downstream.
Named entity recognition (NER). Extracting the things people are talking about — brands, products, technologies, people, organizations — from raw text. This turns a wall of comments into a structured list of entities with frequency counts over time. Modern LLM-based NER can outperform older rule-based approaches, especially on informal text like social media posts, but is much slower and costlier, 2 things you need to consider if building a production-grade system that requires scale.
Topic modeling. Algorithms like LDA (Latent Dirichlet Allocation) or more modern approaches like BERTopic (an entire pipeline) cluster documents into thematic groups without predefined categories. Run topic modeling on a corpus of subreddit posts over time, and you can watch new topics emerge — appearing as distinct clusters that didn't exist in prior time periods. What's extremely challenging is maintaining that topic structure over time. Topic modeling is great for one-time analyses to figure out "what's in this data?", but imagine you introduce a single new post, should you re-run the entire model? Should you try and fit that post into an existing cluster? What if no existing cluster is a good fit? Where do you put the post? Solving these problems, at scale, in near-real-time systems is extremely challenging, and typically requires a bespoke machine learning research phase, where a system is designed for your specific needs. Topic modeling requires analyzing trade-offs of speed, cost, and corpus-specific keywords.
Sentiment analysis. Determining whether the conversation around a topic is positive, negative, or neutral — and tracking how that sentiment shifts over time. A topic that's generating increasingly positive sentiment as it grows in volume is behaving differently from one that's growing through controversy. Both are "trending," but they have very different implications. This is somewhat of a solved problem (tons of free models online), but quality is always an issue. It's typically better to train a sentiment classifier on domain-specific data to get reliable outputs. Sentiment models out of the box can be quite shaky. To go beyond this, some models (also free on places like HuggingFace) try and measure emotion; also shaky without domain-specific training. Large language models can now detect nuance, sarcasm, enthusiasm levels, and even emotional subcategories (excitement vs. satisfaction vs. relief) with high accuracy. Aspect-based sentiment analysis narrows further, evaluating sentiment toward specific features of a topic rather than the topic as a whole.
Embeddings. Rather than searching for specific keywords, embedding models convert text into high-dimensional vectors where semantically similar content clusters together. This lets you find conceptually related discussions even when people are using different words to describe the same emerging phenomenon — which is exactly what happens in the early stages of a trend, before the vocabulary has standardized.
Layer 3: Statistical Methods for Detecting Emergence
This is where the actual "trend detection" happens. You've collected data and converted it into structured signals. Now you need to determine which of those signals represent genuine emergence versus noise.
Moving averages and rate-of-change analysis. The simplest and often most effective approach. Compute a rolling average of mention frequency for a topic over time, then measure the rate of change. A topic whose 7-day moving average is consistently above its 30-day moving average — and the gap is widening — is accelerating. This is the core logic behind most trend detection systems, including sophisticated commercial ones.
Z-score anomaly detection. For each topic, compute the mean and standard deviation of its mention frequency over a baseline period (say, 90 days). Then calculate how many standard deviations today's count is from that mean. A Z-score above 2.0 means today's activity is statistically unusual for this topic. Above 3.0, and something is genuinely breaking from its historical pattern. This is computationally cheap, easy to implement, and surprisingly robust.
Seasonal decomposition (STL). Time series data often contains seasonal patterns — weekly cycles, monthly cycles, annual cycles. STL (Seasonal and Trend decomposition using LOESS) separates a time series into three components: the seasonal pattern, the underlying trend, and the residual. Analyzing the trend component in isolation tells you whether a topic is genuinely growing or just experiencing its regular seasonal peak.
Changepoint detection. Algorithms like PELT (Pruned Exact Linear Time) or Bayesian changepoint detection identify the specific moments when a time series shifts from one statistical regime to another. Rather than asking "is this topic growing?", changepoint detection asks "when did this topic's behavior fundamentally change?" — which is often a more useful question for trend identification.
Velocity and acceleration metrics. This attempts to measure the rate of growth, and the rate of change of the rate of growth. A topic that's growing linearly at 100 new mentions per day is very different from one that went from 10 to 100 to 1,000 over three consecutive days. The second is exhibiting exponential dynamics — the mathematical signature of viral spread and genuine emergence.
Cross-source correlation. A signal that appears in only one source could be a platform-specific artifact. A signal that appears simultaneously across Reddit, TikTok, search data, and patent filings is almost certainly real. Tracking correlation across independent data sources is one of the highest-confidence methods for validating emergence.
Layer 4: Classification and Scoring
Once you have a set of candidate signals, you need to separate genuine emerging trends from false positives. This is where you combine the statistical signals into a composite score.
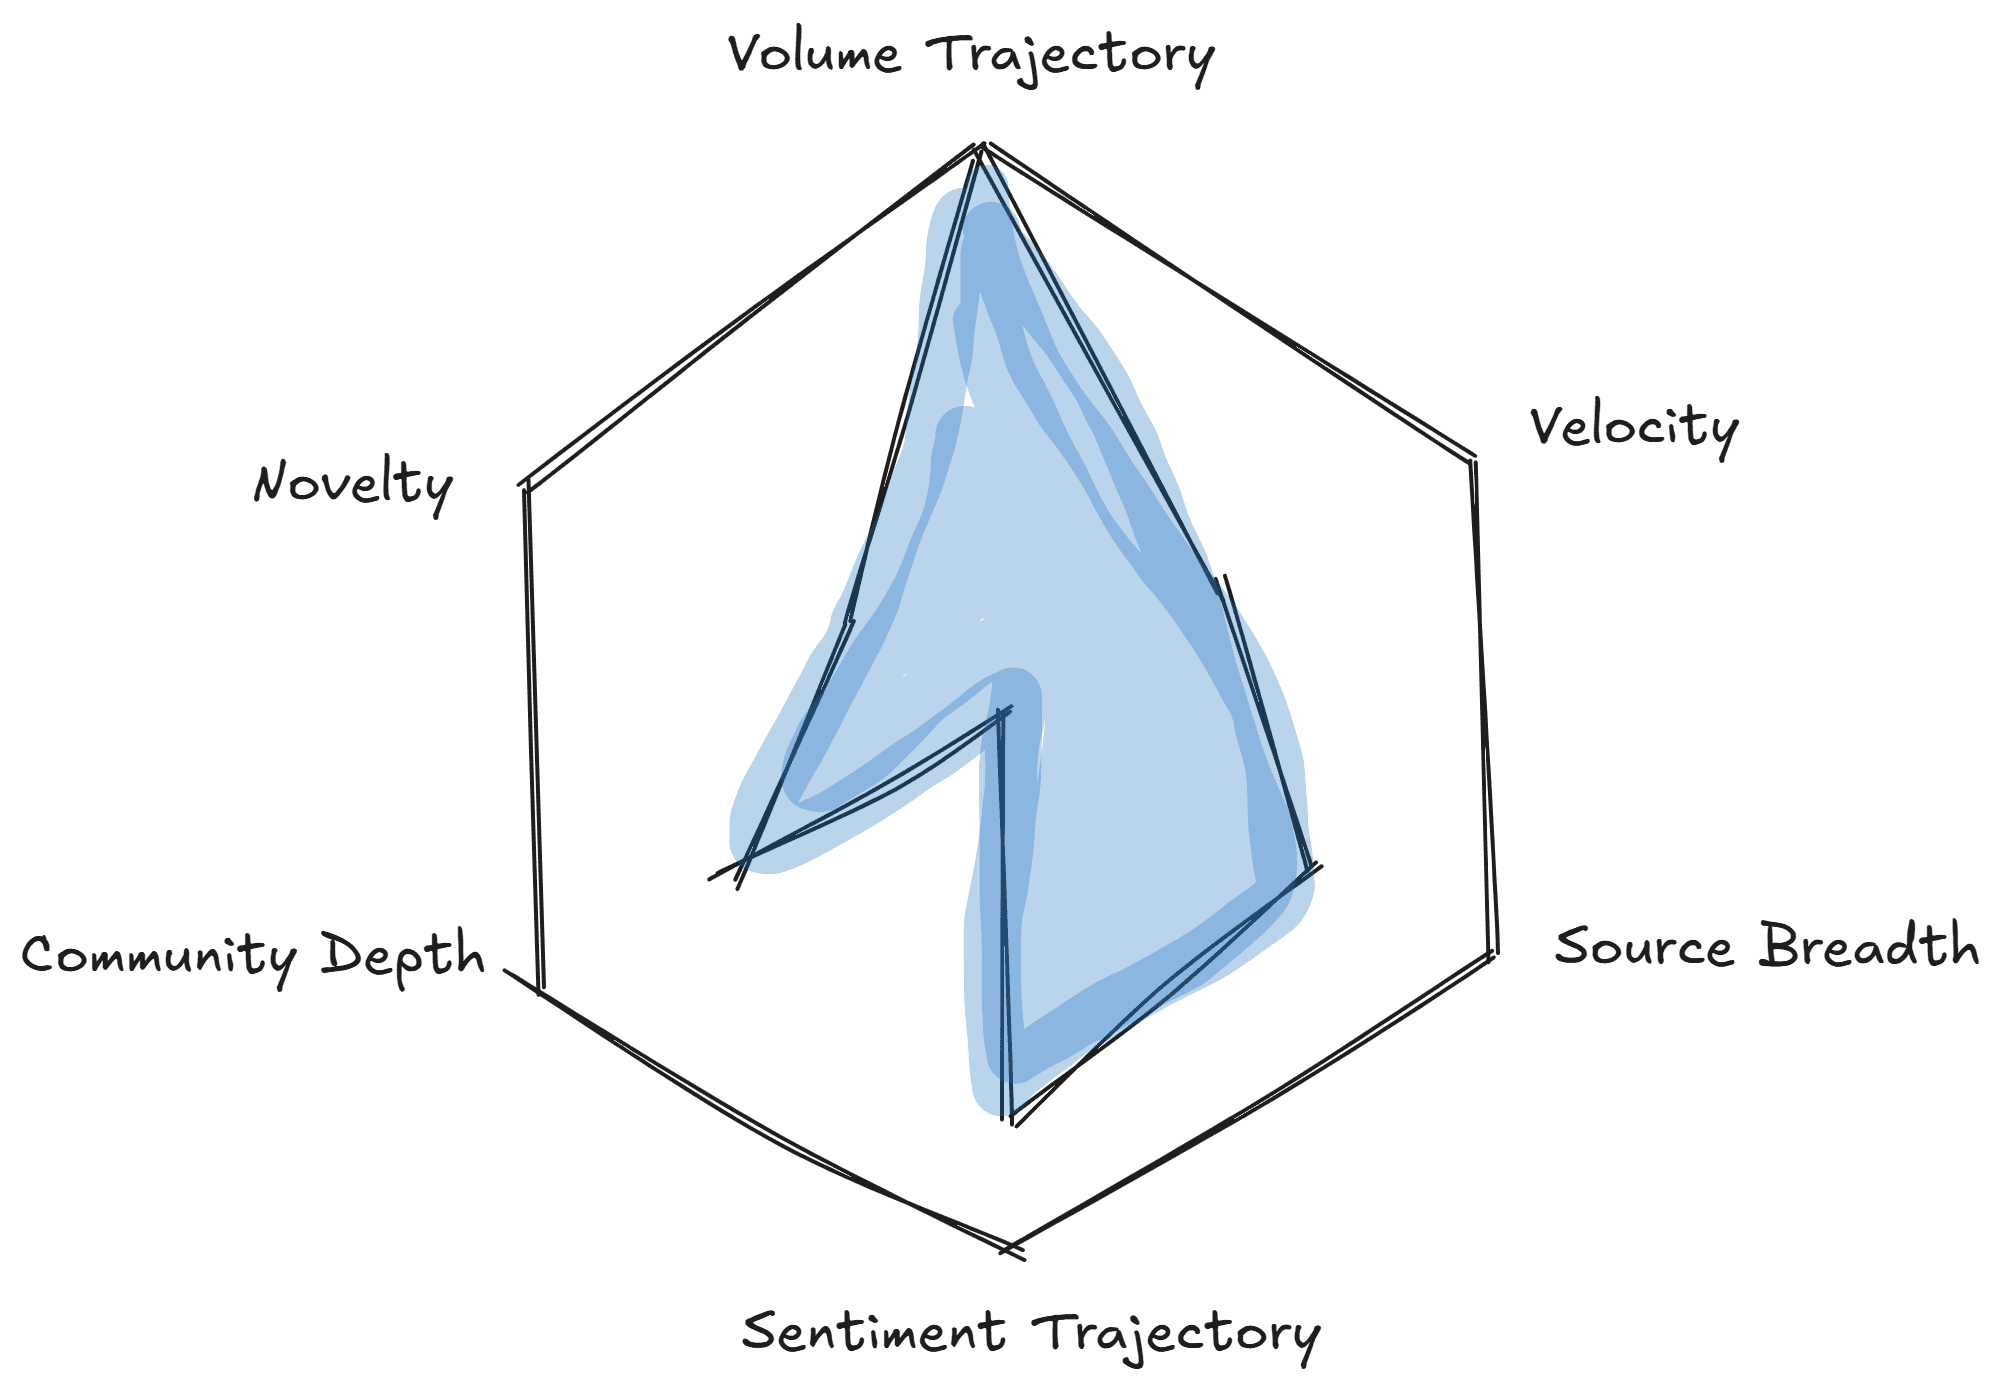
A practical scoring framework might weight:
Volume trajectory (is it growing?) — measured by moving average crossovers
Velocity (how fast is it growing?) — measured by week-over-week or day-over-day growth rate
Source breadth (is it growing in multiple places?) — measured by cross-platform detection
Sentiment trajectory (is sentiment improving as volume grows?) — measured by sentiment trend
Community depth (are engaged communities forming around it?) — measured by reply depth, subscriber growth, repeat participants
Novelty (is this genuinely new, or a recurring topic?) — measured against historical baselines
Each component gets a normalized score, and a weighted composite tells you which signals deserve attention. The weights should reflect your specific use case: a VC scanning for investment themes might weight patent and GitHub signals heavily; a brand marketer might weight TikTok velocity and sentiment more.
Building a Lightweight Trend Detection Pipeline With Claude
Here's how to build a functional pipeline using publicly available tools and Claude as your analysis layer.
Step 1: Pick Your Signal Sources
Start narrow. Choose two or three sources that are most relevant to your domain:
For consumer trends: Reddit (specific subreddits) + TikTok hashtag tracking + Google Trends
For technology trends: GitHub trending repos + Hacker News + arXiv preprints
For market/business trends: Reddit (r/investing, r/startups, industry-specific subs) + LinkedIn + earnings call transcripts
For cultural trends: TikTok subcultures + Reddit + Pinterest Trends
Fore think tanks or policy makers: Congressional Records + keynote speaker livestreams
Step 2: Set Up Data Collection
For example, on Reddit you can use the Reddit API (via PRAW in Python) to pull posts and comments from target subreddits on a daily cadence. Store the raw data in a simple JSON or CSV format with timestamps, engagement metrics, and full text.
If you're using Claude Code, here's an example prompt of what you need; have it generate the collection script:
Claude Code will produce a script that you can run on a cron job or schedule with a task runner. Here are some other prompts you could try:
For Google Trends, the pytrends library gives you programmatic access to search interest data. For TikTok, third-party tools and creative scraping approaches are needed given the API restrictions (check out tools like Browserbase).
Step 3: Build Your NLP Processing Layer
This is where most of the engineering effort lives — and where most trend detection projects stall. You need to build (or stitch together) multiple distinct NLP components, each with its own dependencies, model choices, and failure modes:
Entity extraction. Use a named entity recognition model to pull out the things people are discussing — technologies, companies, products, concepts. Out-of-the-box NER models struggle with informal social media text, emerging terminology, and domain-specific jargon, so expect to spend significant time on custom training data and post-processing rules.
Topic modeling. Run a topic modeling algorithm over your collected corpus to cluster posts into thematic groups. This requires tuning embedding models, adjusting cluster parameters (min_topic_size, n_components), and building a pipeline that can compare topic distributions across time periods to detect new clusters that didn't exist in prior windows. BERTopic with a sentence-transformer embedding model is the current best practice, but it requires GPU resources for any non-trivial corpus size.
Sentiment classification. For each post and extracted topic, classify sentiment. You can start with VADER for speed, but its accuracy on social media text is limited — especially for sarcasm, mixed sentiment, and domain-specific language. A fine-tuned transformer (RoBERTa or similar, trained on labeled examples from your specific sources) will perform better but requires labeled training data, which means annotation work.
Novelty detection. Compare extracted entities and topics against a historical baseline to flag genuinely new signals. This requires maintaining a rolling index of previously seen entities and computing semantic similarity between new and existing topics — typically using cosine similarity over embedding vectors. The threshold for "novel" versus "recurring" requires manual calibration against your domain.
Aggregation and normalization. Combine outputs from each component into a unified data structure: topic, mention count, average sentiment, novelty flag, source, timestamp. This sounds straightforward until you're dealing with entity disambiguation (is "GPT-5" the same entity as "OpenAI's next model"?), duplicate detection across sources, and normalization of sentiment scores across different classifiers.
Each of these components can be built with open-source tools — Hugging Face Transformers, spaCy, scikit-learn, BERTopic, NLTK — but integrating them into a reliable pipeline that runs daily and produces consistent, comparable outputs is a genuine engineering project. Budget weeks, not days, for the first working version.
Here are some prompts:
Step 4: Compute Trend Scores
Take Claude's structured output and compute your trend metrics in a simple Python script or even a spreadsheet:
Week-over-week mention growth for each extracted topic
Sentiment trajectory (is average sentiment improving?)
Cross-source presence (does the topic appear in multiple of your monitored sources?)
Novelty flag (did Claude identify it as new?)
Weight these into a composite score. Sort by composite score. The top entries are your candidate emerging trends.
Prompt:
Step 5: Validate and Act
The final — and most important — step is human judgment. Statistical signals tell you something is happening. Understanding what it means and whether it matters for your specific context requires domain expertise.
For each candidate trend, ask:
What's driving this? Is there a root cause event, or is it organic emergence?
Who's participating? Are these credible domain experts, early adopters, or noise?
What's the addressable implication? If this trend continues, what changes for your business, your portfolio, your content strategy?
What's the time horizon? Is this a micro-trend that'll peak in two weeks, or a structural shift with a multi-year arc?
Scaling Up: From Project to Production System
The lightweight pipeline above is genuinely useful — many small teams and individual analysts run variations of exactly this. But if you need to monitor at scale (hundreds of subreddits, thousands of keywords, multiple platforms simultaneously), the architecture needs to evolve. If you don't want to build, optimize, scale, and maintain this pipeline (or similar ones), check out what we do at Siftree! We do all of this (and more) for you.
Automated Ingestion Pipelines
Move from manual or cron-based collection to streaming ingestion. Tools like Apache Kafka or cloud-native equivalents ingest data continuously from multiple sources. Each data source becomes a producer; your analysis layer becomes a consumer.
AI Agent Integration
The most advanced trend detection systems don't just surface signals for human review — they enable AI agents to query structured data programmatically, formulate hypotheses, run follow-up queries, and synthesize findings.
Protocols like MCP (Model Context Protocol) — now an open standard adopted by Anthropic, OpenAI, Google, and Microsoft — define a universal interface for AI agents to connect to external data sources and issue structured queries. An agent connected to a trend detection knowledge base via MCP can do things like: "retrieve all topics with mention velocity above 200% week-over-week and positive sentiment above 0.6, then cross-reference with patent filing data from the last 90 days."
This is a qualitative leap from the "collect, analyze, report" loop — it's a system that can explore data the way a skilled analyst would, iterating and drilling deeper autonomously. The risk here is reproducibility, accuracy, and auditability because agents are non-deterministic. In high-stakes decision-making scenarios, you want to be able to trust the outputs you're getting; especially if it involves capital allocation. Ensuring that your agents produce the SAME OUTPUT for the same questions is extremely difficult. These are also features that Siftree handles (and guarantees!).
Common Mistakes in Trend Detection
A few patterns reliably kill trend detection efforts. Avoid these:
Confusing volume with emergence. A topic with 100,000 mentions that's been flat for six months isn't emerging — it's established. A topic with 500 mentions that tripled in the last week is. Always prioritize rate of change over absolute volume.
Ignoring base rates. A 300% increase in mentions sounds impressive until you realize it went from 1 mention to 4. Establish minimum thresholds before applying growth metrics. Statistical significance matters.
Platform bias. If you only monitor Twitter/X, you'll detect Twitter-native trends but miss what's happening on Reddit, Discord, TikTok, or GitHub. Diversify your sources.
Overfitting to your own interests. Confirmation bias is the enemy of trend detection. The most valuable trends to detect are the ones you weren't looking for. Build systems that surface surprises, not just validations.
Skipping validation. Every automated system produces false positives. Budget time for human review. A trend detection system that sends 50 alerts per day, none of which are actionable, will be ignored within a week.
Reacting to spikes instead of trajectories. A single-day spike is usually news-driven and short-lived. A sustained upward trajectory over weeks or months is a genuine structural shift. Train your system — and your judgment — to distinguish between the two.
The Compounding Advantage
Trend detection is a compounding skill. The first time you build a pipeline and surface a genuine early signal, the value is modest — you might write a timely blog post or bring an insight to a strategy meeting. But over time, the advantage compounds: you develop intuition for signal quality, your data collection broadens, your scoring models improve through feedback, and your organization starts making decisions with a longer lead time than competitors.
The teams that are consistently early to market trends — whether they're brands that jumped on TikTok subcultures before they crossed over, or researchers who identified transformer architectures before the GPT era — aren't operating on gut feeling. They're operating on systems that convert unstructured noise into structured signal.


